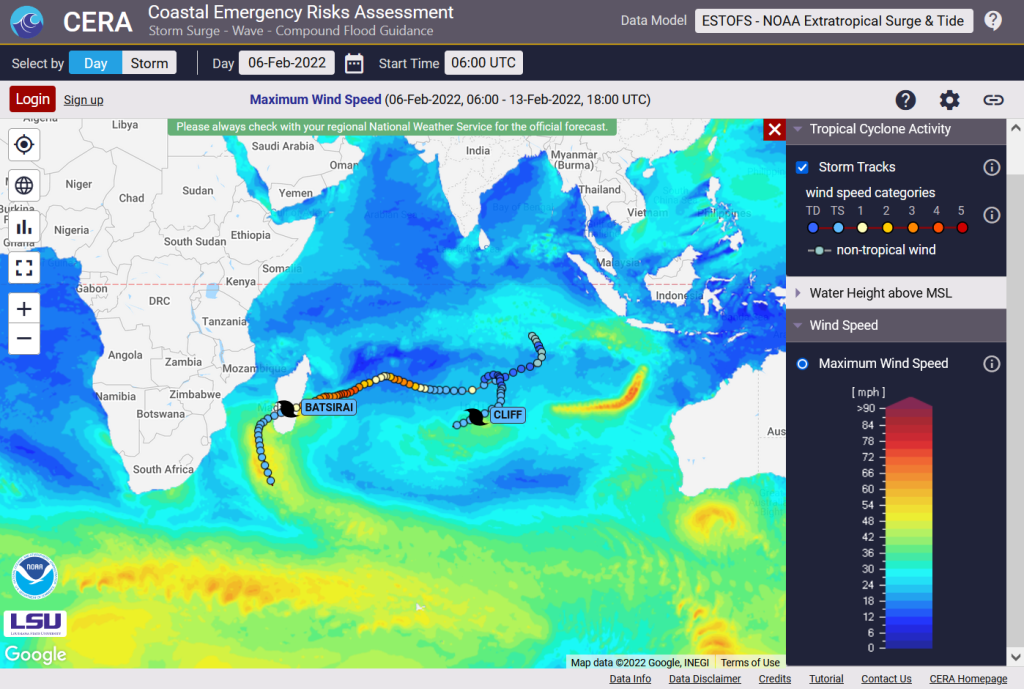

Did you know that about 85 tropical storms form annually over the warm tropical oceans of the globe? And while the majority of tropical cyclones happen in the northern hemisphere with most activity occurring between mid-August and mid-October, tropical cyclones in the southern hemisphere are most frequent during the December through April warm season.
The Coastal Emergency Risks Assessment (CERA) web storm surge guidance system provides water levels and wind information from NOAA’s Global Extratropical Surge and Tide Operational Forecast System (G-ESTOFS) for storm surge and wind guidance around the year. One of our latest features is the overlay of global hurricane and typhoon track information coming from the National Hurricane Center (NHC) and the Joint Typhoon Warning Center (JTWC).