
The CERA Group at Louisiana State University is pleased to announce a release of the CERA storm surge and flood visualization tool for the 2021 hurricane season.
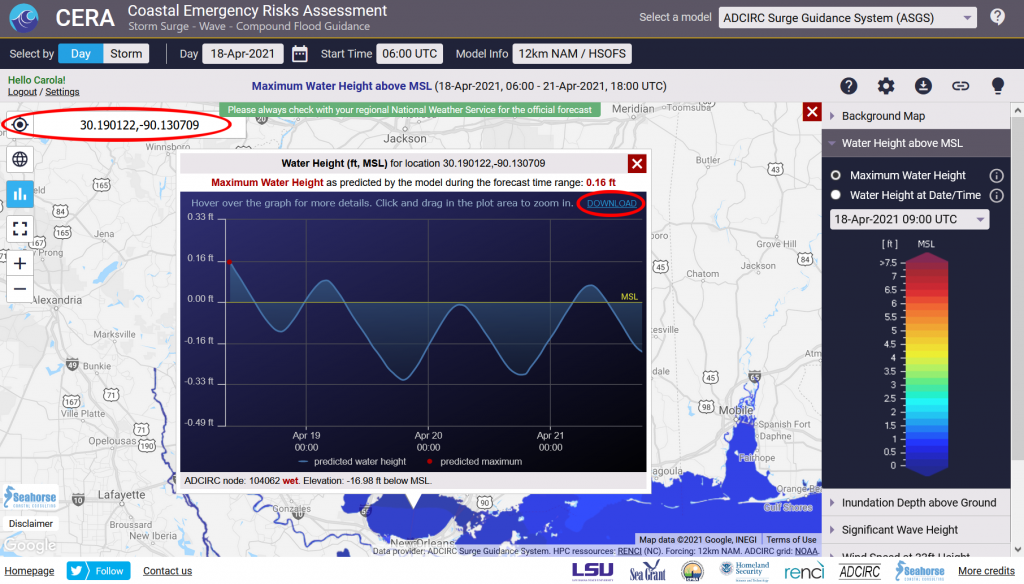
- NEW: Download capability for time series at specific location as requested by user feedback
- NEW: Open time series chart through search by coordinates
If you would like to learn more about these features, please visit this blog entry.
The CERA release also includes the following new features for all models:
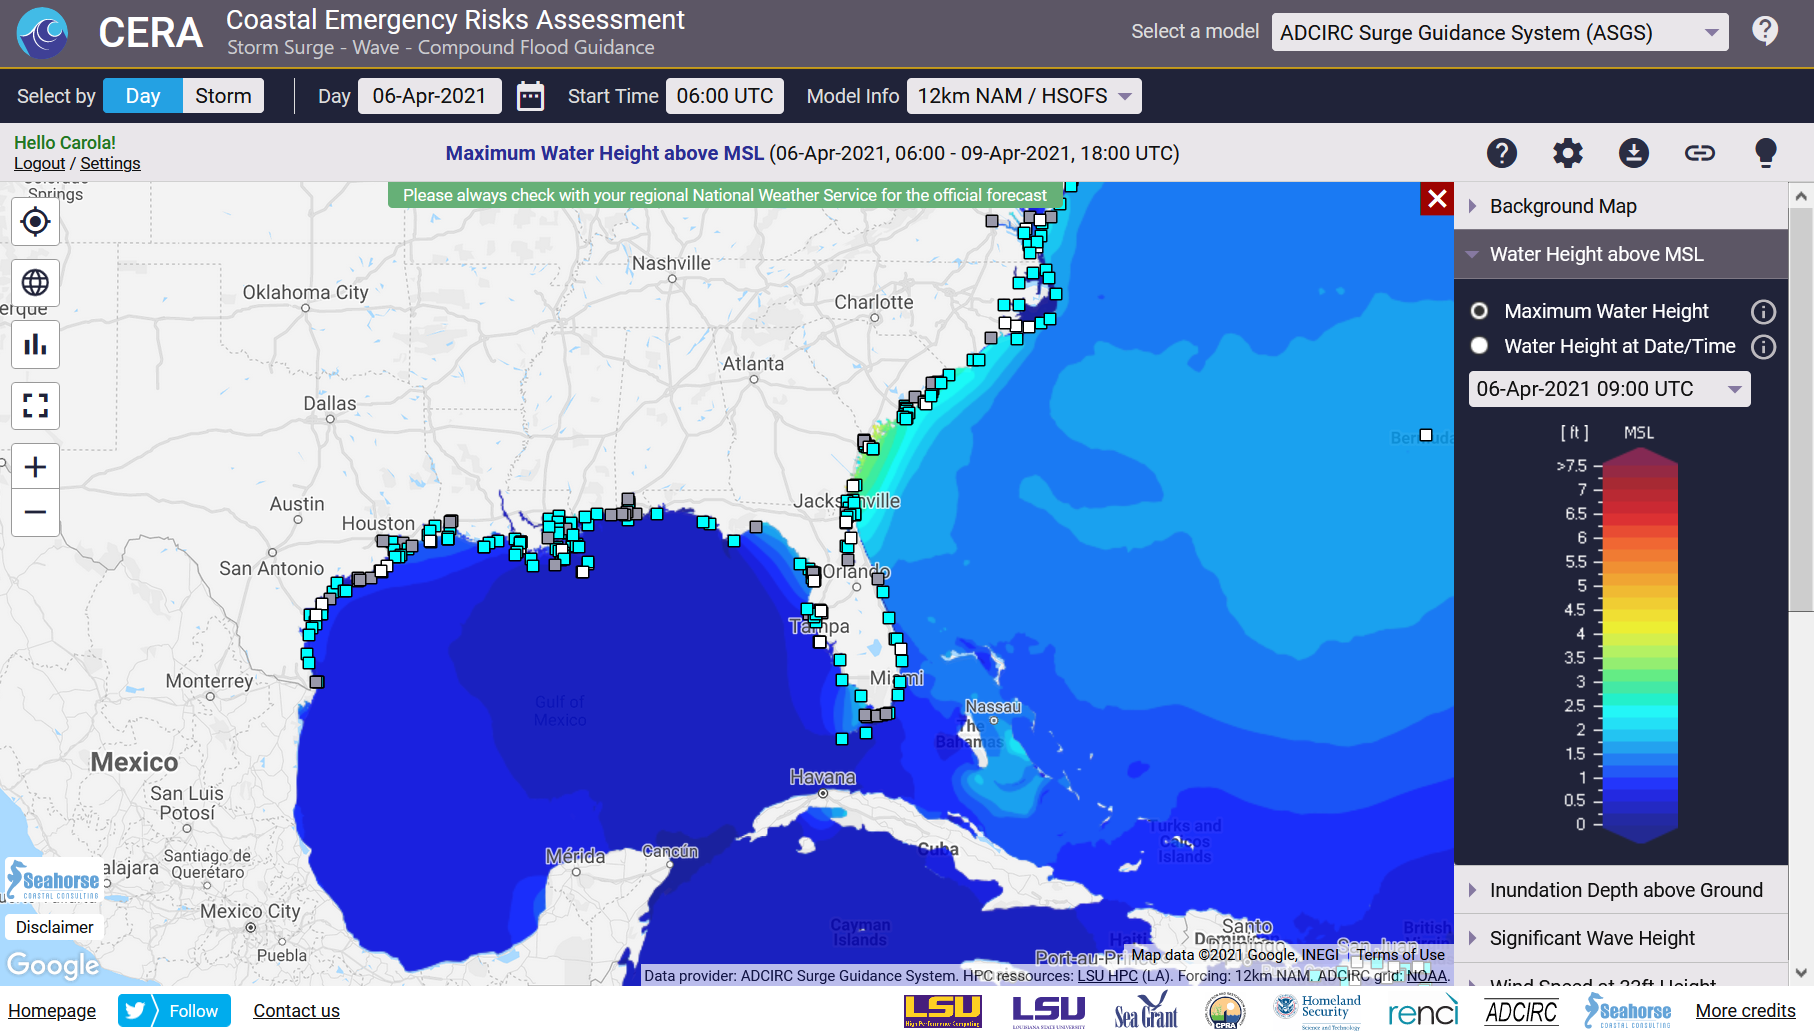
- Vector graphics for a polished look
- Google Maps background map in black and white, putting emphasis on storm surge information visibility
The following new CERA features are for specific storm surge/flood models:
ADCIRC Surge Guidance System (ASGS):
- Update of USGS, USACE, NOAA water level stations to reflect latest agency adjustments
- Download of inundation GeoTiffs for storms as requested by user feedback
- Gage stations show water levels of the previous storm advisory for comparison with the current storm advisory as requested by user feedback
Extratropical Storm Surge and Tide Operational Forecast System (ESTOFS):
- CERA visualizes NOAA’s new ESTOFS-Global mesh including water height and wind; additional features will follow
Compound Flood Inundation Guidance System (CFIGS):
- CFIGS combines influences of precipitation and storm surge/tidal fluctuations developed by CE Hydro, LLC. Results are generated for selected watersheds in Louisiana
- CFIGS will go operational for the 2021 hurricane season and displayed on the CERA website