Did you know that about 85 tropical storms form annually over the warm tropical oceans of the globe? And while the majority of tropical cyclones happen in the northern hemisphere with most activity occurring between mid-August and mid-October, tropical cyclones in the southern hemisphere are most frequent during the December through April warm season.
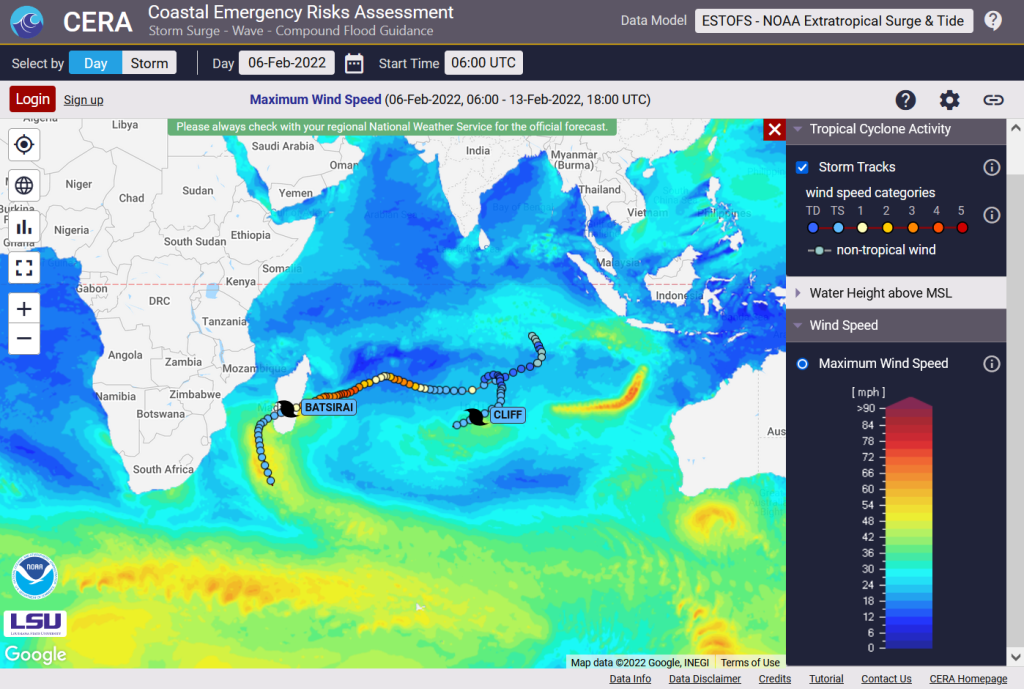
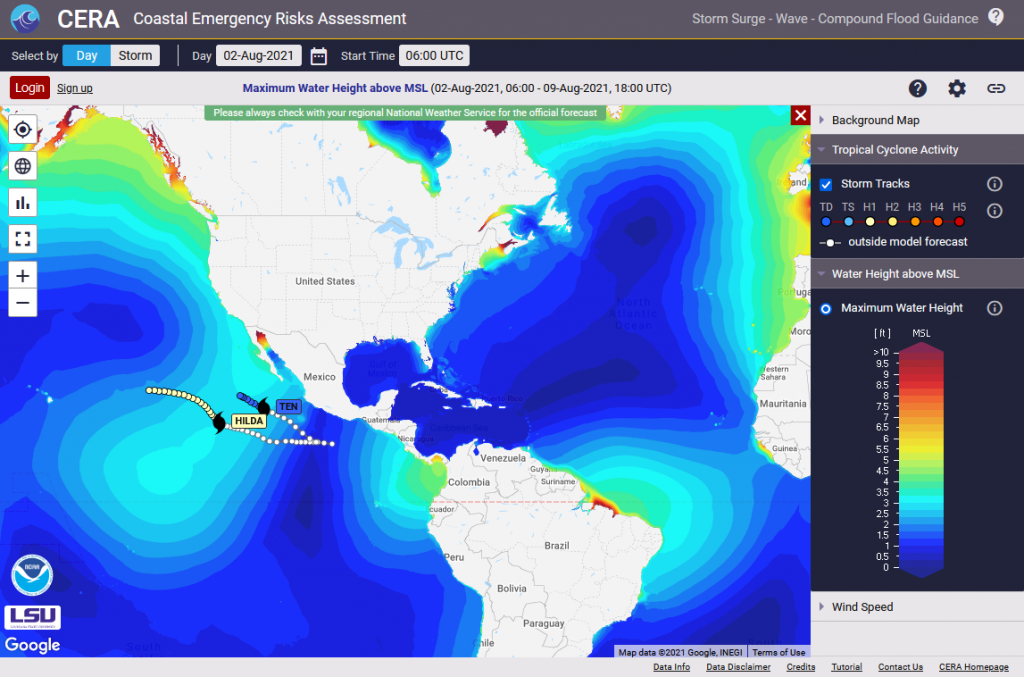
The Coastal Emergency Risks Assessment (CERA) web storm surge guidance system provides water levels and wind information from NOAA’s Global Extratropical Surge and Tide Operational Forecast System (G-ESTOFS) for storm surge and wind guidance around the year. One of our latest features is the overlay of global hurricane and typhoon track information coming from the National Hurricane Center (NHC) and the Joint Typhoon Warning Center (JTWC).
CERA displaying tropical cyclone track activity in the southern hemisphere in Feb 2022
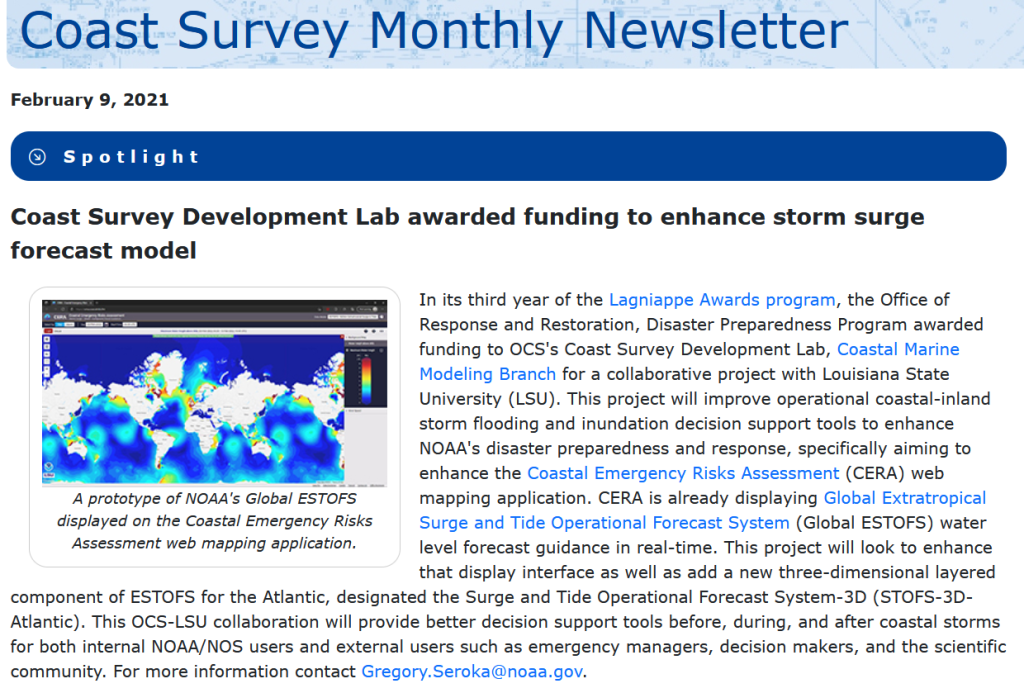
In January 2022, the NOAA Coast Survey Development Lab (CSDL) was awarded funding to improve storm surge modeling to further enhance NOAA’s disaster preparedness and response. The Louisiana State University (LSU) Coastal Emergency Risks Assessment (CERA) web mapping application is an integral part of this collaborative project to deliver storm surge and inland flooding model results to the public and the modeling community.
The award was published in the February edition of NOAA’s Coast Survey Newsletter:
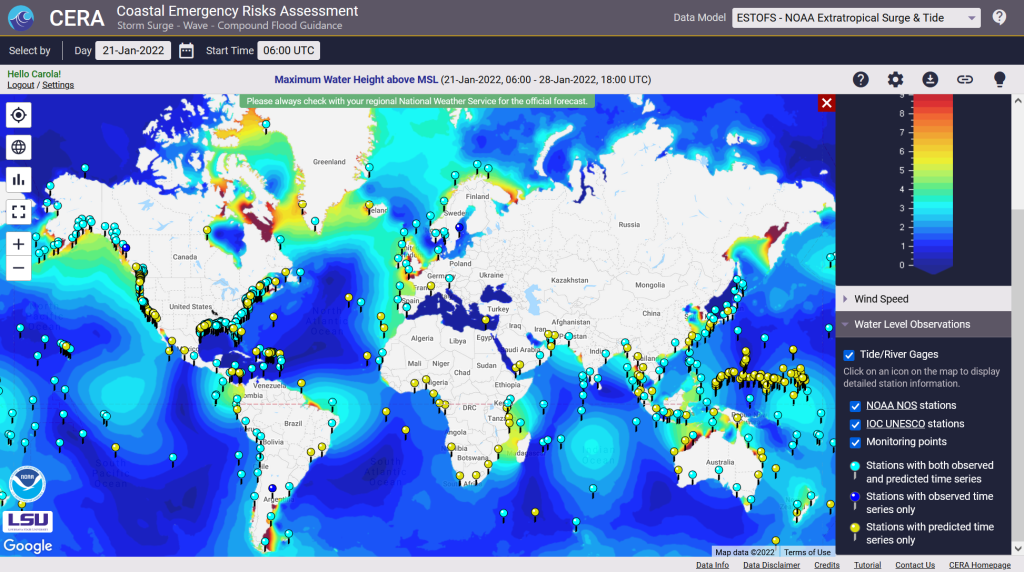
We are delighted to introduce our latest CERA enhancement that provides 558 global water level points from the NOAA Extratropical Surge and Tide Operational Forecast System (ESTOFS) system on a daily basis.
About ESTOFS: The NOAA/NOS/Coast Survey Development Lab and the NOAA National Centers for Environmental Prediction (NCEP) produce storm surge guidance for extratropical systems through their Extratropical Surge and Tide Operational Forecast System (ESTOFS) four times daily out to 7.5 days. The ESTOFS model uses the storm surge model ADCIRC forced by real time output of atmospheric pressure, winds, and sea ice from the NCEP Global Forecast System (GFS) and is run on NOAA’s WCOSS super computing system to produce numerical outputs. The global unstructured grid consists of 8 million nodes with a coastal grid resolution of up to 80 m for Hawaii and the US West Coast, and up to 120 m for the US East Coast, Puerto Rico, Micronesia, and Alaska.
The Coastal Emergency Risks Assessment (CERA) visualization tool provides ESTOFS results on its interactive visualization website (https://cera.coastalrisk.live) once daily, including global water level heights and wind speed results. The newly added ESTOFS water level stations combine predicted forecast water levels from the model with observed water levels from the NOAA Tide & Currents service and the Intergovernmental Oceanographic Commission (IOC) Sea Level Station Monitoring Facility.
In addition to this new feature, we made major updates to all water level stations along the US coast, including services from NOAA, USGS, and the USACE.
CERA-PRO provides global water level stations from the NOAA Extratropical Storm Surge and Tide Operational ForecastSystem (ESTOFS) once daily
On July 27, 2021, the National Centers for Environmental Prediction (NCEP) Central Operations upgraded the Global Extratropical Surge & Tide Operational Forecast System (Global ESTOFS) to version 2. This upgrade contains major improvements in model performance, resolution, and coverage to provide high resolution water level forecast guidance including storm tide for the entire globe.
The CERA visualization system makes this upgrade available through it’s online portal at cera.coastalrisk.live.
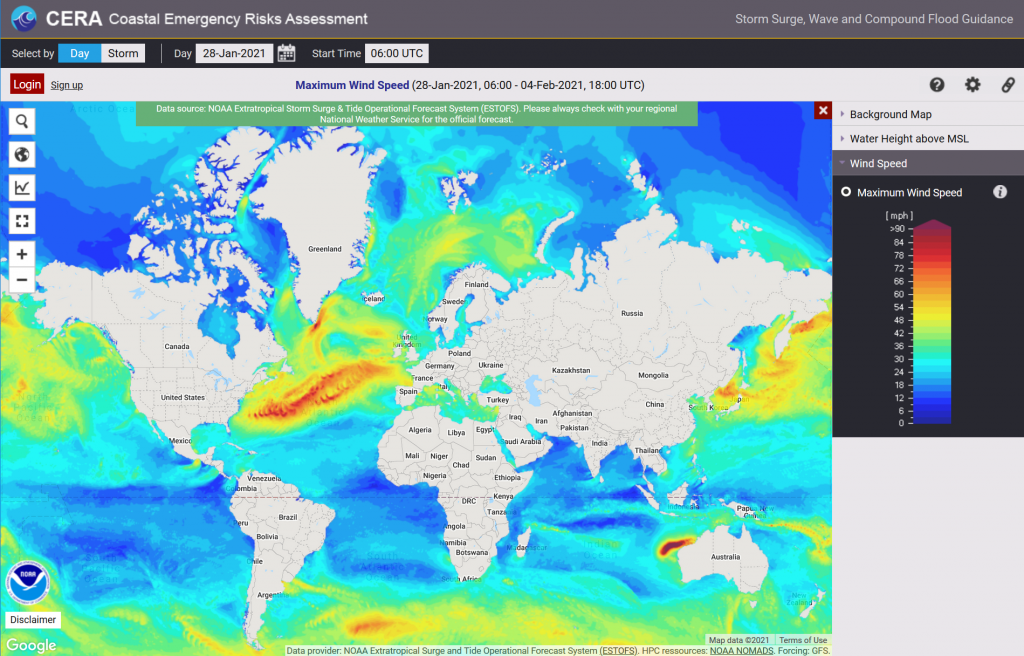
We have been working with the NOAA Coast Survey Group to retrieve the ESTOFS-Global maximum wind levels from their cloud service and are happy to announce that the GFS forced wind maps are now available on the CERA web mapping tool.
By default, opening CERA (https://cera.coastalrisk.live) displays the ESTOFS maximum water height layer. If you wish to view the wind layer, please select the wind speed tab in the map legend.
ESTOFS-Global wind layer on CERA. Data: courtesy of NOAA Coast Survey Group
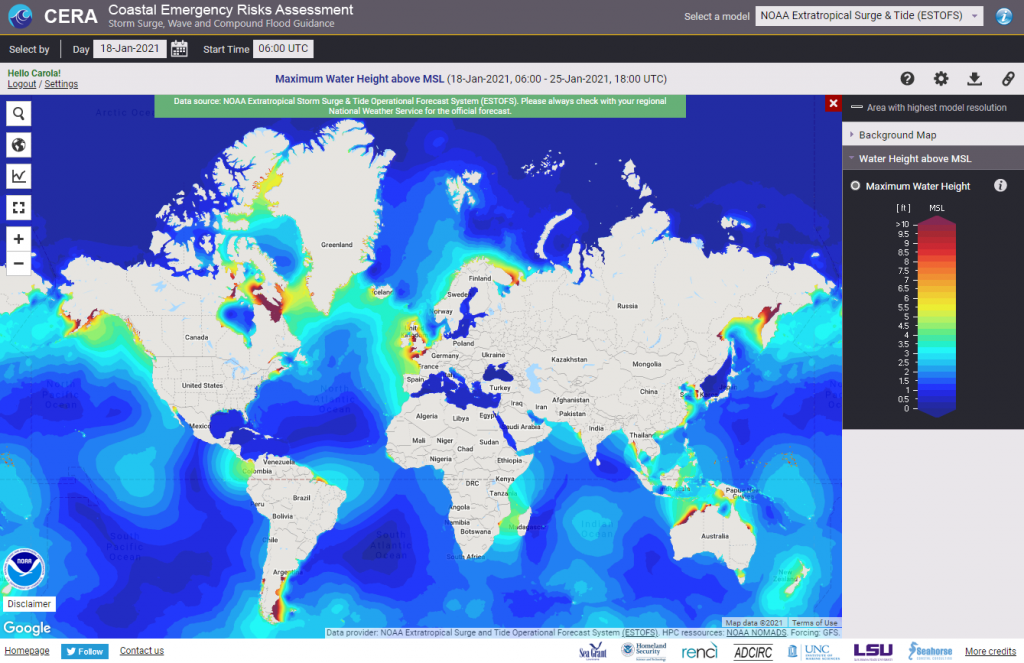
The CERA team is happy to announce a major upgrade using the Global Extratropical Surge & Tide Operational Forecast System (ESTOFS-Global) developed by NOAA’s Office of Coast Survey. High-resolution water level forecast guidance is now provided for the entire globe.
ESTOFS-Global as viewed on CERA
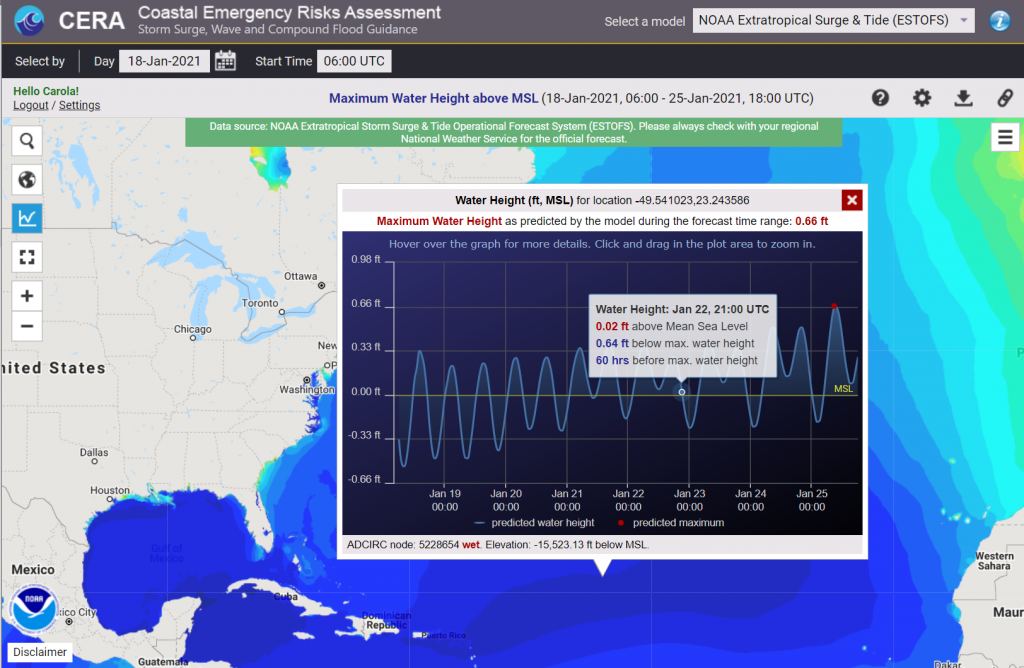
CERA provides the maximum water level height for the 06Z UTC cycle once a day. Using the CERA ‘time series’ feature displays maximum water levels at any point of interest on the map.
Unregistered users will now see the ESTOFS-Global map by default. Registered users can switch between ESTOFS-Global and customized maps from ADCIRC Surge Guidance System (ASGS) at any time using the ‘Select a model’ box at the top of the site.
You can also use the “Map Settings” option dialog at the upper right of the website to change your model preference upon opening CERA.
A time series on ESTOFS-Global on CERA
With this update, CERA transcends its national capability to an international level in extratropical flood forecasting using NOAA’s data.