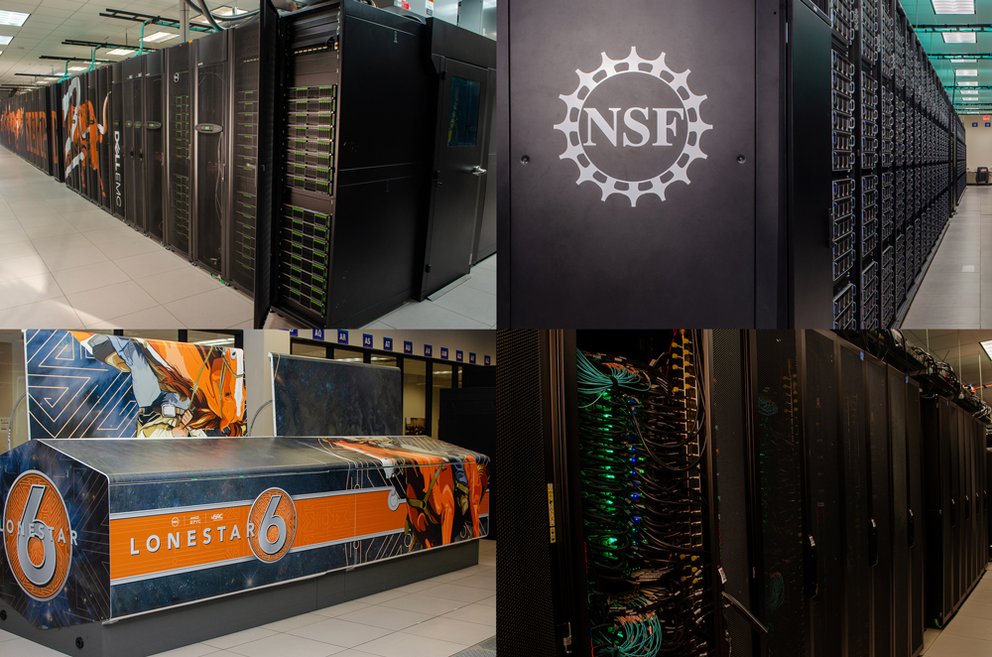
The 2024 Atlantic hurricane season caused hundreds of deaths, and more than $200 billion in damages. In efforts to protect lives and property, the The Texas Advanced Computing Center supercomputers, namely Frontera, Stampede3, and Lonestar6, were deployed to feed storm models and events into the CERA platform for state-of-the-art surge forecasting and emergency preparedness. TACC is exploring artificial intelligence and machine-learning techniques to even further accelerate predictions and refine simulation models.
Since 2000, a significant amount of tropical storms have made landfall on the Atlantic Coast and the Northern Gulf of Mexico.
Our newly launched website historicalstorms.coastalrisk.live includes more than 50 tropical storms that involved injury or loss of life, incurred damages to property, and made significant economic impact.
The comprehensive CERA Storm Surge Archive archive provides water height, wind, and wave data based on the ‘Best Tracks’ from the National Hurricane Center (NHC) and the ADCIRC storm surge model. Each storm can be explored in detail with CERA’s visualization tool using the Best Tracks – Historical U.S. Storms data model option.
Hurricane IAN impacting West Florida and the Atlantic Coast in October 2022
Did you know that about 85 tropical storms form annually over the warm tropical oceans of the globe? And while the majority of tropical cyclones happen in the northern hemisphere with most activity occurring between mid-August and mid-October, tropical cyclones in the southern hemisphere are most frequent during the December through April warm season.
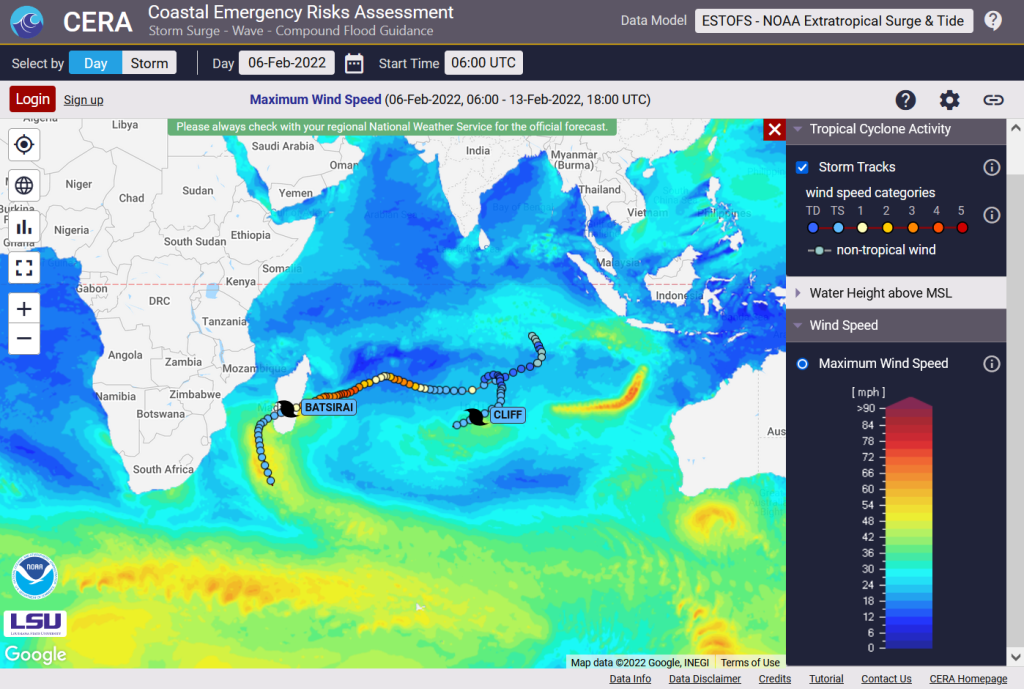
The Coastal Emergency Risks Assessment (CERA) web storm surge guidance system provides water levels and wind information from NOAA’s Global Extratropical Surge and Tide Operational Forecast System (G-ESTOFS) for storm surge and wind guidance around the year. One of our latest features is the overlay of global hurricane and typhoon track information coming from the National Hurricane Center (NHC) and the Joint Typhoon Warning Center (JTWC).
CERA displaying tropical cyclone track activity in the southern hemisphere in Feb 2022
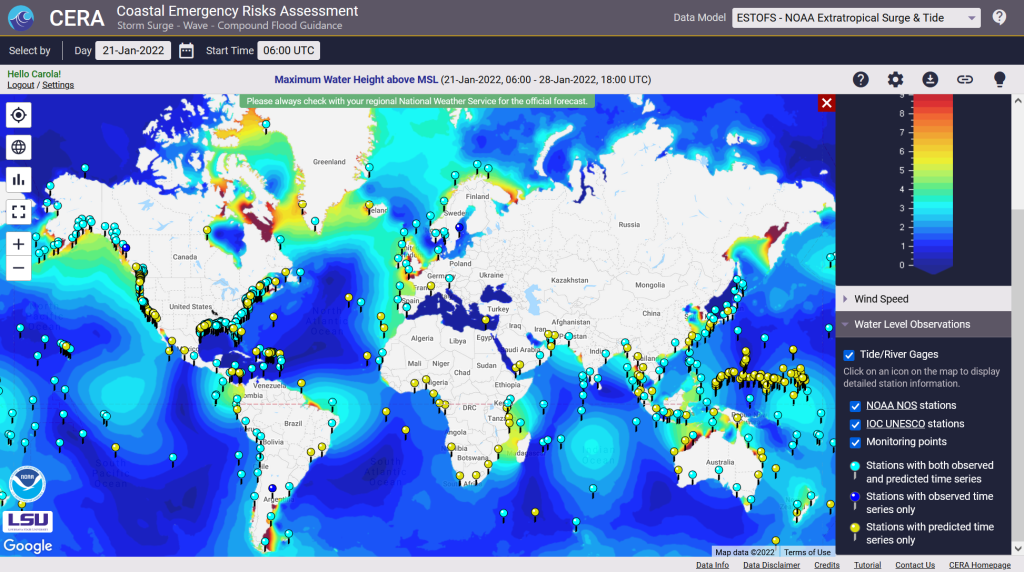
We are delighted to introduce our latest CERA enhancement that provides 558 global water level points from the NOAA Extratropical Surge and Tide Operational Forecast System (ESTOFS) system on a daily basis.
About ESTOFS: The NOAA/NOS/Coast Survey Development Lab and the NOAA National Centers for Environmental Prediction (NCEP) produce storm surge guidance for extratropical systems through their Extratropical Surge and Tide Operational Forecast System (ESTOFS) four times daily out to 7.5 days. The ESTOFS model uses the storm surge model ADCIRC forced by real time output of atmospheric pressure, winds, and sea ice from the NCEP Global Forecast System (GFS) and is run on NOAA’s WCOSS super computing system to produce numerical outputs. The global unstructured grid consists of 8 million nodes with a coastal grid resolution of up to 80 m for Hawaii and the US West Coast, and up to 120 m for the US East Coast, Puerto Rico, Micronesia, and Alaska.
The Coastal Emergency Risks Assessment (CERA) visualization tool provides ESTOFS results on its interactive visualization website (https://cera.coastalrisk.live) once daily, including global water level heights and wind speed results. The newly added ESTOFS water level stations combine predicted forecast water levels from the model with observed water levels from the NOAA Tide & Currents service and the Intergovernmental Oceanographic Commission (IOC) Sea Level Station Monitoring Facility.
In addition to this new feature, we made major updates to all water level stations along the US coast, including services from NOAA, USGS, and the USACE.
CERA-PRO provides global water level stations from the NOAA Extratropical Storm Surge and Tide Operational ForecastSystem (ESTOFS) once daily
The CERA Group at Louisiana State University is pleased to announce a release of the CERA storm surge and flood visualization tool for the 2021 hurricane season.
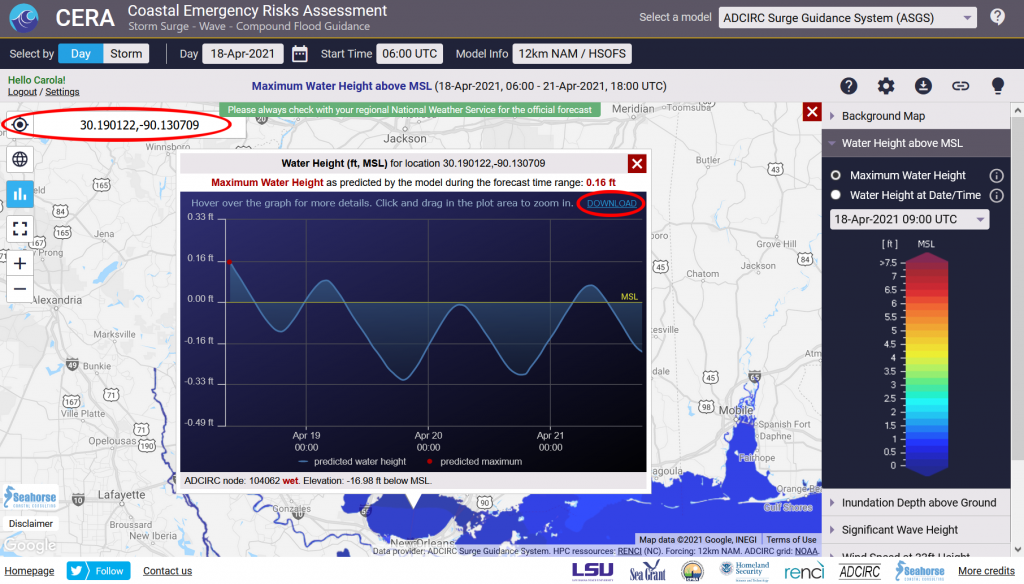
NEW: Download capability for time series at specific location as requested by user feedback
NEW: Open time series chart through search by coordinates
If you would like to learn more about these features, please visit this blog entry.
The CERA release also includes the following new features for all models:
Vector graphics for a polished look
Google Maps background map in black and white, putting emphasis on storm surge information visibility
The following new CERA features are for specific storm surge/flood models:
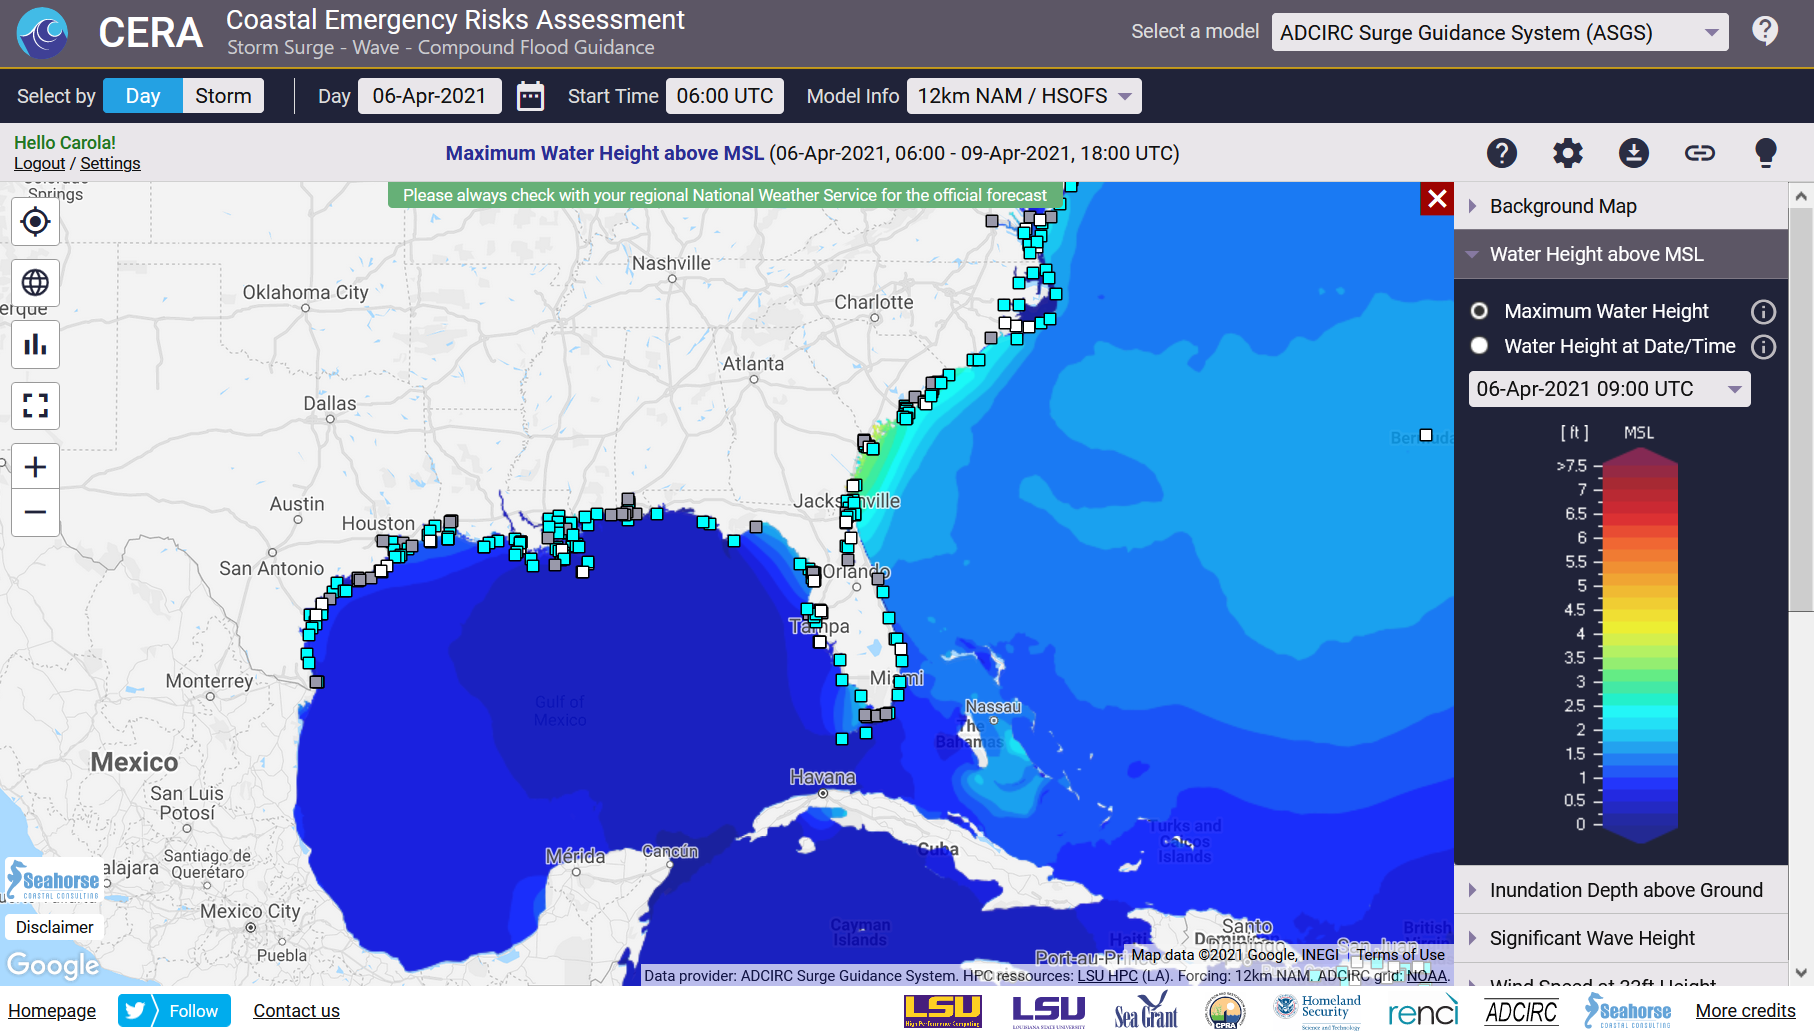
ADCIRC Surge Guidance System (ASGS):
Update of USGS, USACE, NOAA water level stations to reflect latest agency adjustments
Download of inundation GeoTiffs for storms as requested by user feedback
Gage stations show water levels of the previous storm advisory for comparison with the current storm advisory as requested by user feedback
Extratropical Storm Surge and Tide Operational Forecast System (ESTOFS):
CERA visualizes NOAA’s new ESTOFS-Global mesh including water height and wind; additional features will follow
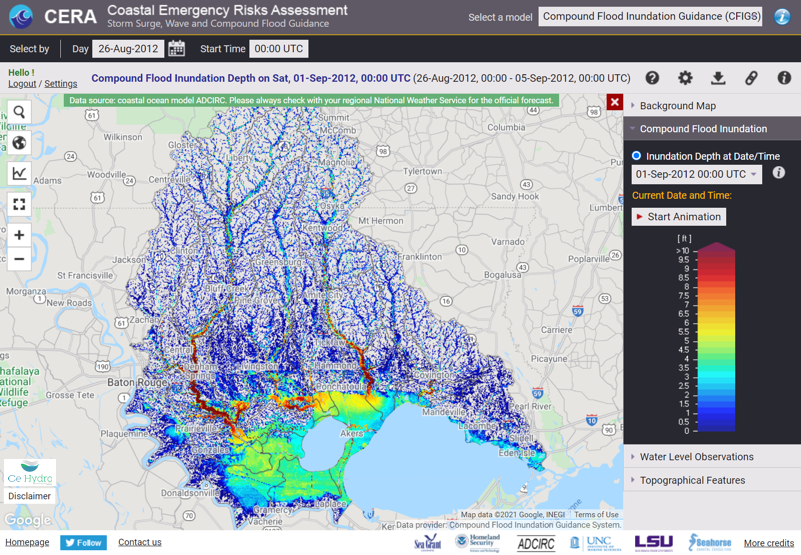
Compound Flood Inundation Guidance System (CFIGS):
CFIGS combines influences of precipitation and storm surge/tidal fluctuations developed by CE Hydro, LLC. Results are generated for selected watersheds in Louisiana
CFIGS will go operational for the 2021 hurricane season and displayed on the CERA website
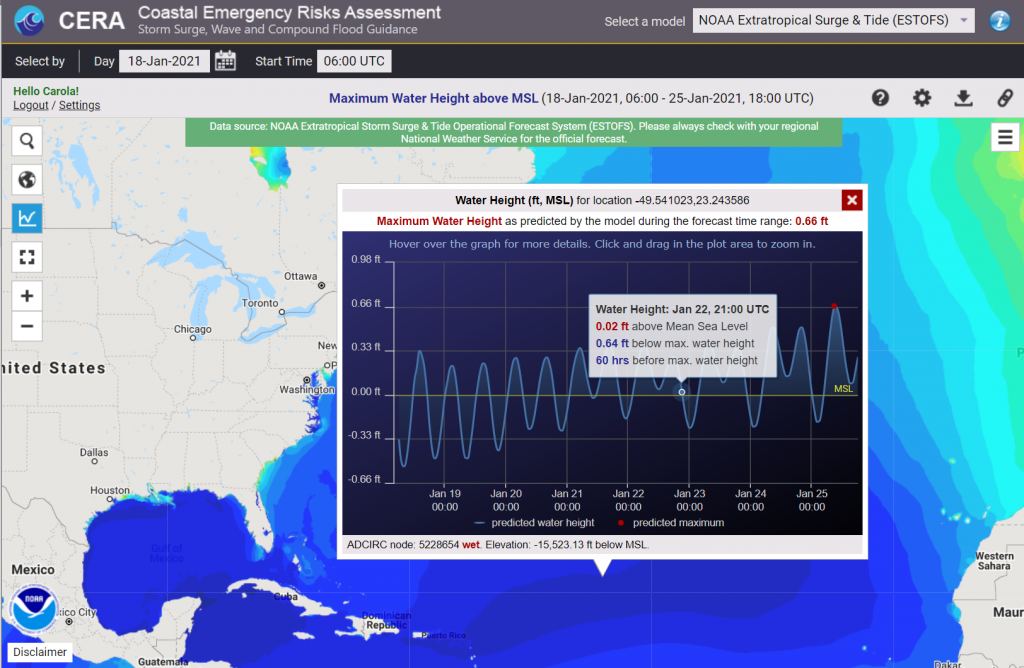
CERA visualizes time series for water levels, wind, and significant wave height for any location on the map. To use this feature, click on the time series button on the left of the map, then click on the desired location on the map.
CERA’s 2021 release now allows downloading the selected time series as a .json file. The download link is in the top right of the time series chart.
If finding a time series for a specific coordinate point is desired, click on the time series button, then click on the location search button on the left of the map. If you already have a chart open, the coordinate pair is pre-filled in the search box. If you would like to find another place, enter the coordinate as [latitude, longitude]. CERA will open the time series chart automatically.
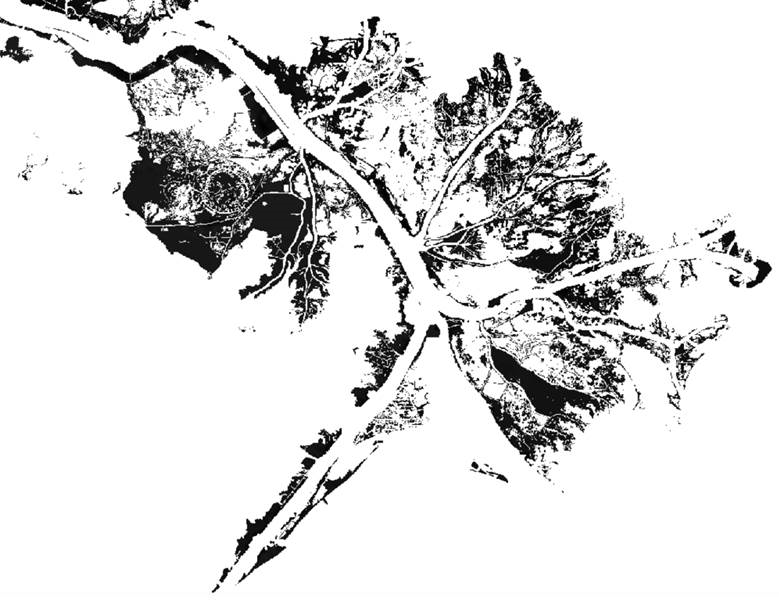
What is the Compound Flood Inundation Guidance System (CFIGS)? CFIGS is a compound flood prediction system developed at CE Hydro, capable of predicting flooding due to the combined influences of precipitation and storm surge/tidal fluctuations. It provides flood inundation guidance to promote understanding of the timing and extent of flooding before the event.
With CERA’s headquarters at the Louisiana State University (LSU), the team is excited to include this local and unique model prototype on immediate display for users to view and operate. View it here on CERA.
CFIGS as viewed on CERA
CFIGS was made possible with the support from Coastal Protection Restoration Authority (CPRA), Louisiana SeaGrant, Louisiana State University (LSU), Seahorse Coastal Consulting and Freese and Nichols, Inc (FNI).
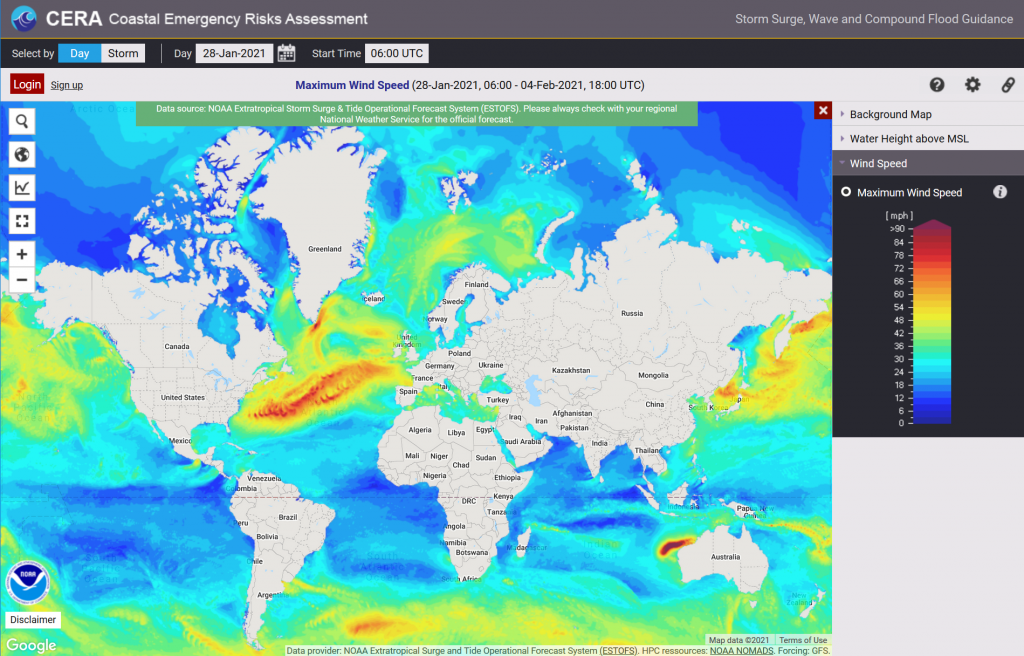
We have been working with the NOAA Coast Survey Group to retrieve the ESTOFS-Global maximum wind levels from their cloud service and are happy to announce that the GFS forced wind maps are now available on the CERA web mapping tool.
By default, opening CERA (https://cera.coastalrisk.live) displays the ESTOFS maximum water height layer. If you wish to view the wind layer, please select the wind speed tab in the map legend.
ESTOFS-Global wind layer on CERA. Data: courtesy of NOAA Coast Survey Group
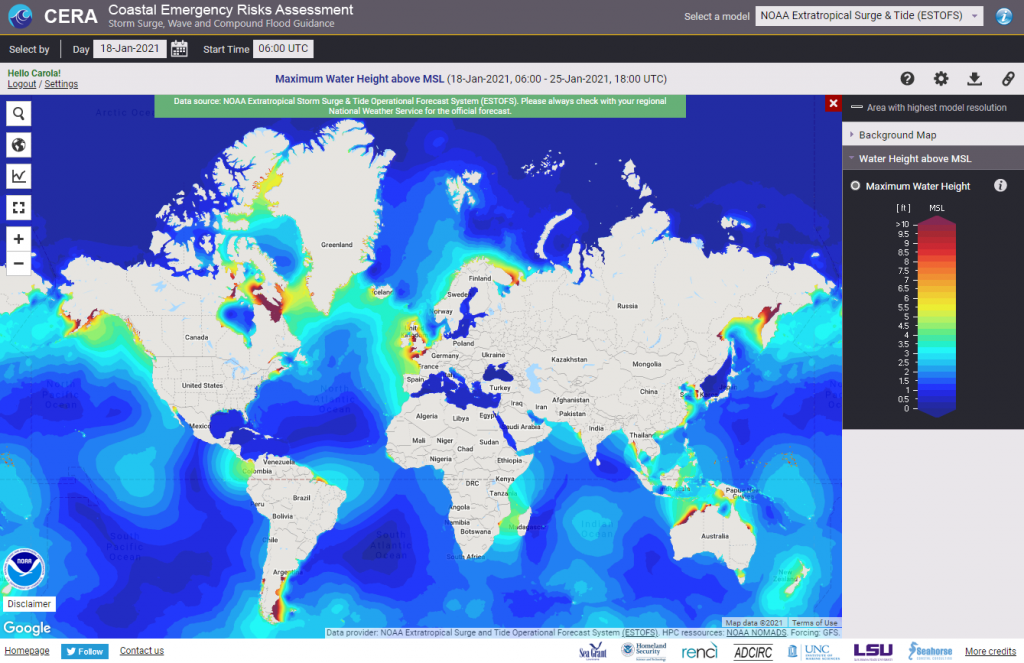
The CERA team is happy to announce a major upgrade using the Global Extratropical Surge & Tide Operational Forecast System (ESTOFS-Global) developed by NOAA’s Office of Coast Survey. High-resolution water level forecast guidance is now provided for the entire globe.
ESTOFS-Global as viewed on CERA
CERA provides the maximum water level height for the 06Z UTC cycle once a day. Using the CERA ‘time series’ feature displays maximum water levels at any point of interest on the map.
Unregistered users will now see the ESTOFS-Global map by default. Registered users can switch between ESTOFS-Global and customized maps from ADCIRC Surge Guidance System (ASGS) at any time using the ‘Select a model’ box at the top of the site.
You can also use the “Map Settings” option dialog at the upper right of the website to change your model preference upon opening CERA.
A time series on ESTOFS-Global on CERA
With this update, CERA transcends its national capability to an international level in extratropical flood forecasting using NOAA’s data.
The CERA Group is excited to announce a first release for selected hindcasts that will allow you to download the maximum inundation with a 50 meter resolution from the CERA website.
The following hindcasts are now available for download as GeoTIFF:
2020: Zeta, Delta, Sally, Laura, Isaias, Hanna 2019: Dorian, Barry 2018: Michael, Gordon, Florence 2017: Irma, Harvey 2016: Matthew
To download these GeoTIFFs, please select the maximum inundation layer from the legend for the desired storm, then select the download button in the top right (“Download GeoTIFF”). CERA has the capability to create GeoTIFFs on demand. We will provide this functionality for storm runs in the 2021 hurricane season.